ETH Price Chart Using ReactJS and Cryptocompare API
There are number of Crypto Currency API s available. I'll put some of them here for your future reference.
Cryptonator
Coindesk
CoinCap
Cryptocompare
Nomics
Major of them are most perfect for Bitcoins and I'm going to talk about one of the all-rounder APIs, Cryptocompare API. Why I say so, Cryptocompare API supports with 5,598 coins over 259,915 trading pairs from 176 exchanges.
If you use Cryptocompare API you can do different things with Prices, Historic Data and Crypto News. This article is not to describe about Cryptocompare API. I'm going to explain you how to make an ETH Price Chart using this API.
Selecting API
You can use Historic Data APIs for this task. There are 7 APIs. Select Historical Daily OHLCV
https://min-api.cryptocompare.com/data/histoday?fsym=ETH&tsym=USD&limit=30&aggregate=3&e=Cexio
You can check API Documentation for more details about parameters. I have used "Cexio" as the exchange and request for 30 data points.
Initializing React
Initialize a React project and create .js files for Information box, Line chart and for moving tip. You may need to install moment.js for changing date and time in your preferred formats. Documentation of Moment.js will provide you more details.
npm install moment
Complete project you can find here in my GitHub.
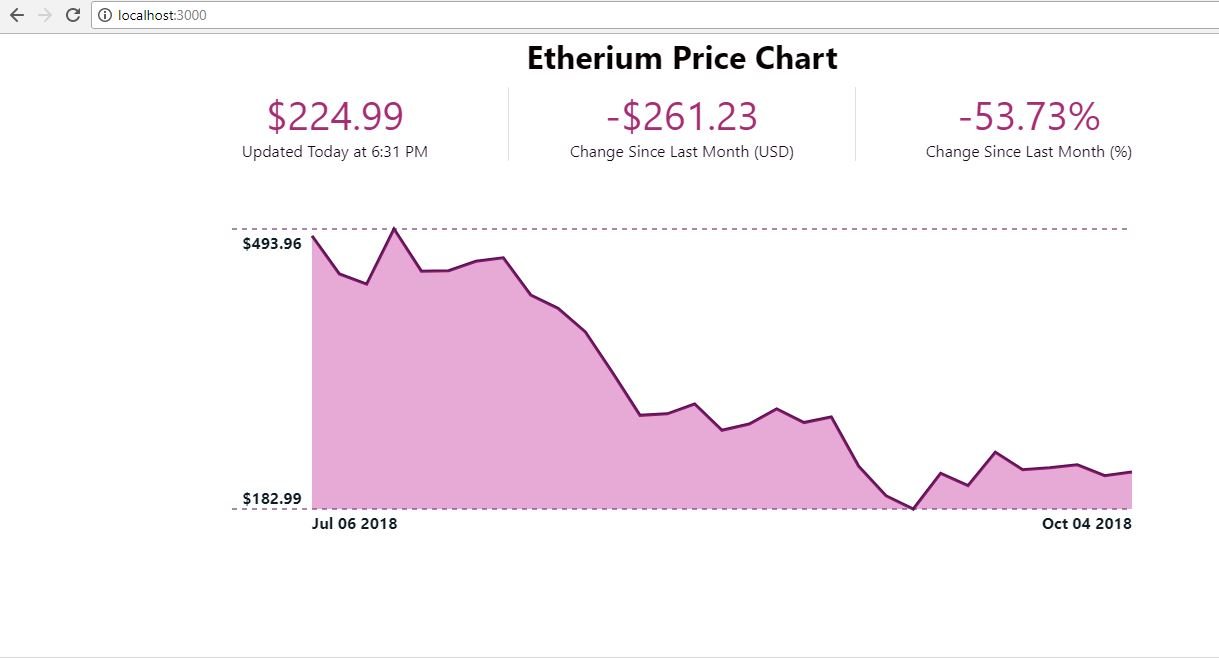
This will be your output when you start the append using cryptocompare API you can easily fetch data for number of coins or tokens from different exchanges. This is more flexible than Coindesk or Bitrex APIs.
Fetching data from API
componentDidMount(){
}
const getData = () => {
const url = 'https://min-api.cryptocompare.com/data/histoday?fsym=ETH&tsym=USD&limit=30&aggregate=3&e=Cexio';
fetch(url).then( r => r.json())
.then((cryptoprice) => {
const sortedData = [];
let count = 0;
for (let date in cryptoprice.Data){
sortedData.push({
d: moment(cryptoprice.Data[date].time*1000).format('MMM DD YYYY'),
p: cryptoprice.Data[date].close.toLocaleString('us-EN',{ style: 'currency', currency: 'USD' }),
x: count,
y: cryptoprice.Data[date].close
});
count++;
}
this.setState({
data: sortedData,
fetchingData: false
})
})
.catch((e) => {
console.log(e);
});
}
getData();
The format of the data as follows.
"time":1531353600,"close":432.61,"high":444,"low":419.83,"open":444,"volumefrom":4958.41,"volumeto":2145461.74
So you to convert this Time format into a different date format using Moment.js
moment(cryptoprice.Data[date].time*1000).format('MMM DD YYYY')
After filtering necessary data for the chart, you can draw the line chart.
It is very easy to create this app with Cryptocompare API and ReactJs. You can build different kind of apps using this too. Thank you!